
Where is Your Audience?
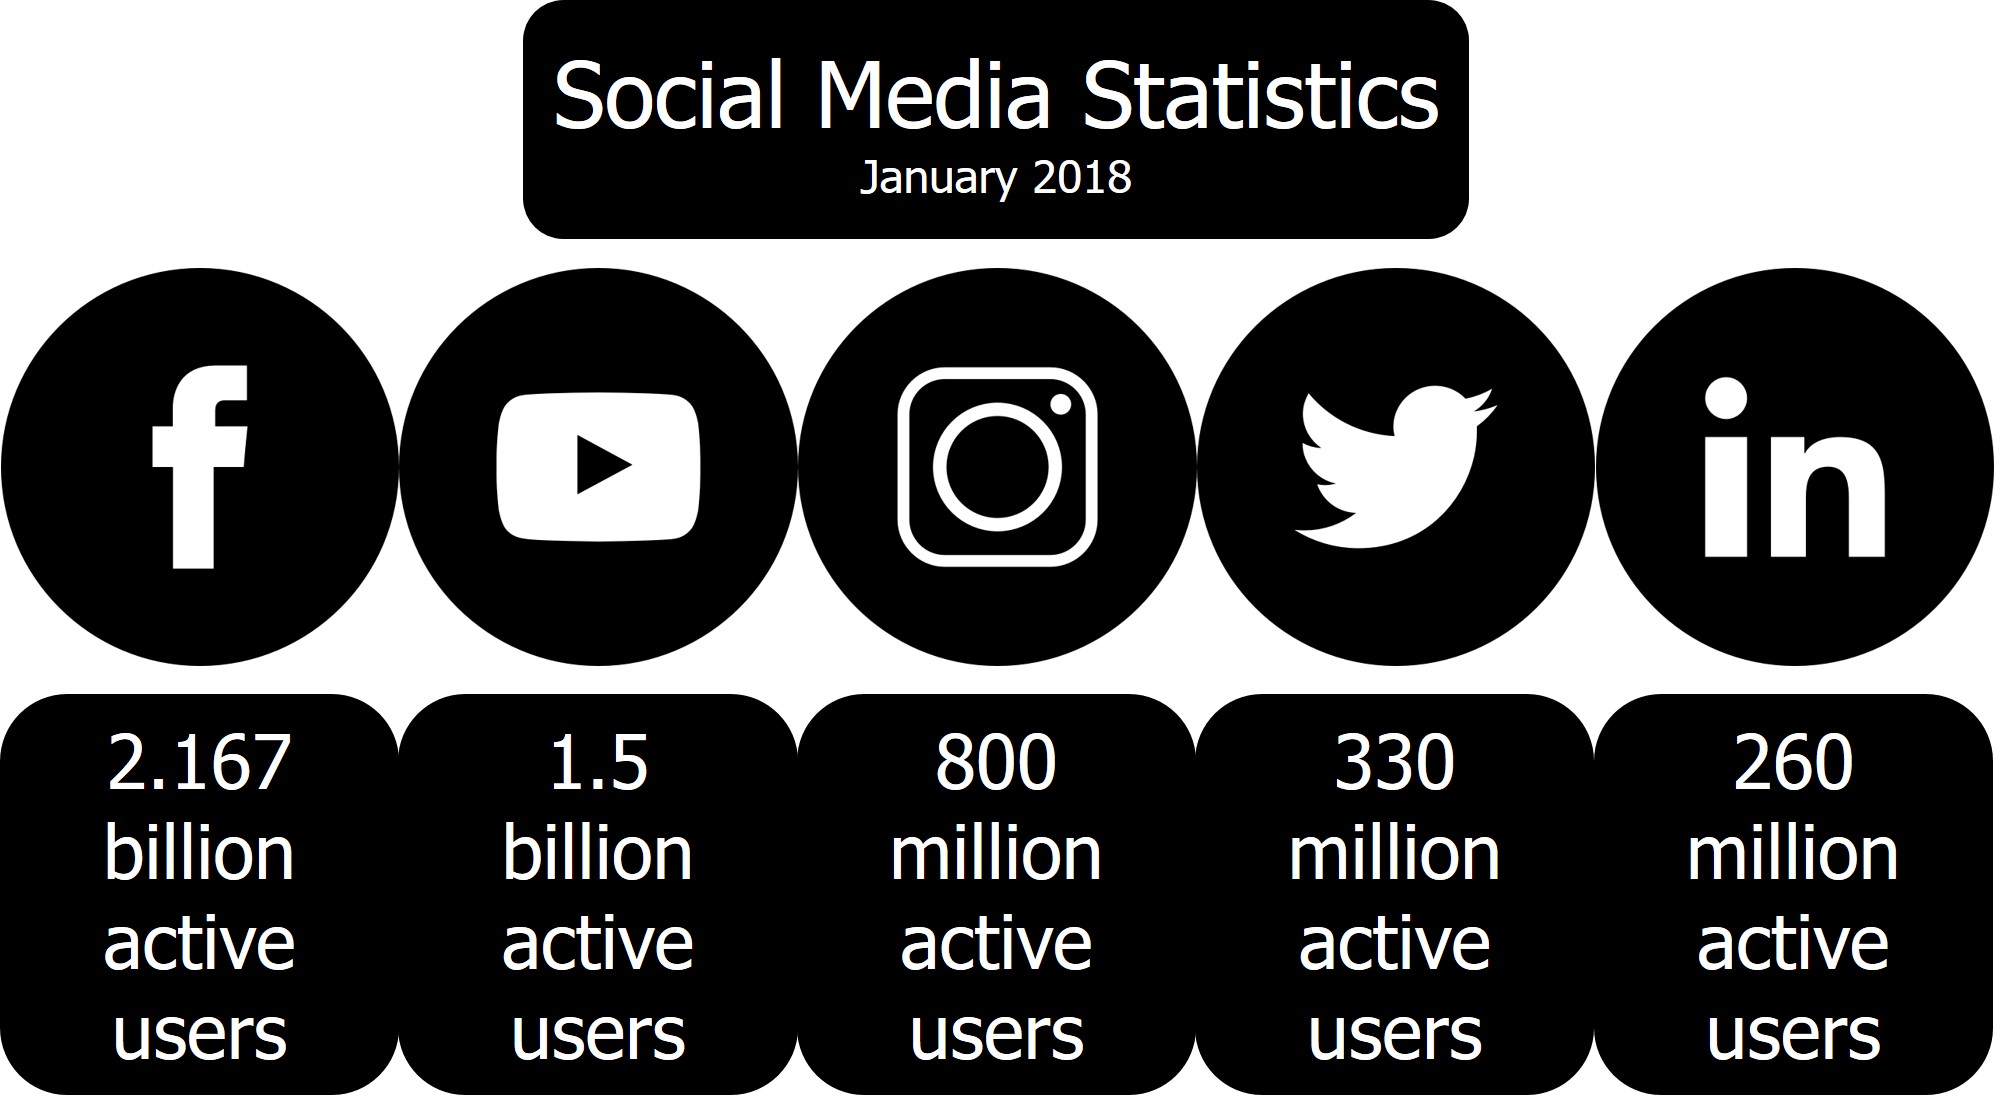
Knowing which social media platforms your audience is on is the first place to begin. Statistics for January 2018 listing the most popular social networks worldwide, ranked by the number of active accounts, shows Facebook (2,167 billion people), as the most active, followed by YouTube (2nd), Instagram (7th), and Twitter (9th)1.
Who is Your Audience?
Knowing your audience is the next key metric to understand. Knowing their gender, age, what proportion are active on which social media platform can help in creating a targeted approach to engagement. Facebook is the most used platform across both genders (83% women versus 75% men) and across all age groups screened (88% of 18-29 year olds; 84% of 30-49 year olds; 72% of 50-64 year olds; and 62% of those aged 65+), followed by Instagram, LinkedIn and Twitter5.
What Does Your Audience Like? (and Not Like?)
Once we know who and where the audience is, we must understand what they do and don’t like to engage with across the different platforms before developing a social media strategy:
On Facebook, posts with:
- images receive 2.3 times more engagement than posts without images3
- less than 250 characters receive 60% more engagement4
On Instagram:
- photos with faces receive 38% more Likes than photos without faces3
On Twitter, tweets with:
- images receive 150% more retweets than tweets without images3
- 1-2 hashtags receive 21% higher average engagement than those with none
- more than 3 hashtags receive 17% less engagement
On LinkedIn5:
- 98% of posts with images receive more comments
- posts with links have a 200% higher engagement rate8
What Content is Popular?
Understanding what marketers use for their social media can help create the right type of content. The most commonly used types of content by marketers are visual images (41%), followed by blogging (32%), video (20%), live video (6%), and podcasting 1%6. One survey found 52% of marketers named video as the type of content with the best return on investment7. This survey also found that 43% of people want to see more video content from marketers. Once we know the type of content to use, how to use it, and on which platforms, understanding paid advertising is the next step to help broaden the companies reach, build its digital presence and build its brand. Facebook ads is used by 93% of marketers, followed by Instagram ads (24%), LinkedIn ads (16%), and Twitter ads (15%)6.
How is Your Audience Referred to Your Web Presence?
The pattern of referral to a company’s web presence can help map out the appropriate plan. One report found LinkedIn (64%) to rank the highest, followed by Facebook (17% and Twitter (14%)8. Therefore, using the right content in the appropriate way on the most effective social media platforms will help build a company’s web presence.
What are the Future Trends?
Looking at what the current and future trends for the use of social media platforms among are in pharma must also figure in any social media strategy. One study found that within the next 1-2 years, Facebook (73%) would be the most popular among social media teams, followed by YouTube (64%), LinkedIn (55%) and Twitter (45%)9.
Next Steps
If you would like to learn how to use these social media metrics to develop an appropriate strategy that will help create a tribe, a loyal fanbase who will buy into your company brand, values and products, please do get in touch!
References
- Tax, * All products require an annual contract Prices do not include sales. Global social media ranking 2017 | Statistic. Statista Available at: https://www.statista.com/statistics/272014/global-social-networks-ranked-by-number-of-users/.
- Social Media Demographics to Inform a Better Segmentation Strategy. Sprout Social (2017). Available at: https://sproutsocial.com/insights/new-social-media-demographics/. (Accessed: 23rd October 2017)
- 10 Visual Content Marketing Statistics to Know for 2017. Louise Myers Visual Social Media (2017). Available at: http://louisem.com/145162/visual-content-marketing-stats.
- Social media engagement – Statistics and Trends [Infographic].
- 40 Essential Social Media Marketing Statistics for 2017 | WordStream. Available at: http://www.wordstream.com/blog/ws/2017/01/05/social-media-marketing-statistics. (Accessed: 30th August 2017)
- Social Media Examiner: Social media marketing how to, research, case studies, news and more! (2015).
- Kolowich, L. 16 Video Marketing Statistics to Inform Your Q4 Strategy [Infographic]. Available at: https://blog.hubspot.com/marketing/video-marketing-statistics.
- Bebusinessed. Numbers Don’t Lie: Impressive Statistics and Figures of LinkedIn. (2017).
- The Most Popular Social Media Platforms in the Pharma Industry for 2017 & 2018. Marketwire Available at: http://www.marketwired.com/press-release/the-most-popular-social-media-platforms-in-the-pharma-industry-for-2017-2018-2229634.htm. (Accessed: 9th October 2017)